Have you tried to build an SRS report on the transactional database, then queried the financial dimensions and displayed them in the report – yes, OK what about offering the report consumer the option of selecting a financial dimension as a multi value parameter?
Displaying the dimensions in the report is not easy but there are many resources that give lots of code examples. If the report is easy than a standard AOT query will give you all you need with Dimension display methods.
The hard part is accepting a parameter value from the report consumer and passing that into your query. Here I will show you how. Remember LedgerTrans and how easy it was to work with dimensions well read on.
I will not create the actual report here but I will create the data source that you can use in a query or data provider. First what is the problem. If you said Microsoft referential integrity gone mad, I hear you, but no. The problem is that you just can’t create a query joining the dimension metadata and then add a range to that structure. Or can you?
We are going to create a data source that displays the individual values for Main account category, Accounting Date, Business Unit, Cost center, Department and AmountMST. From this data source you can use all the technics for queries, ranges, multi-value parameters etc. This also offers excellent performance as the results are aggregated and queried on SQL before we get them.
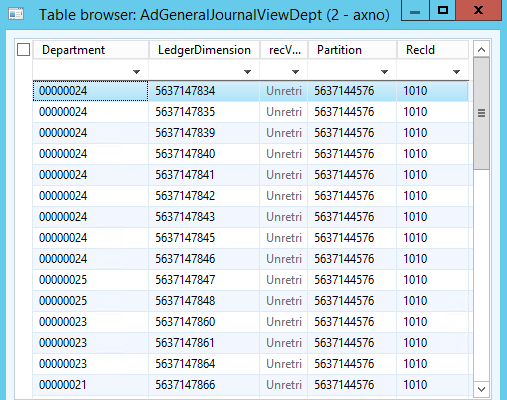
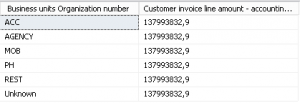
Here is an example of the data in the structure we will create.
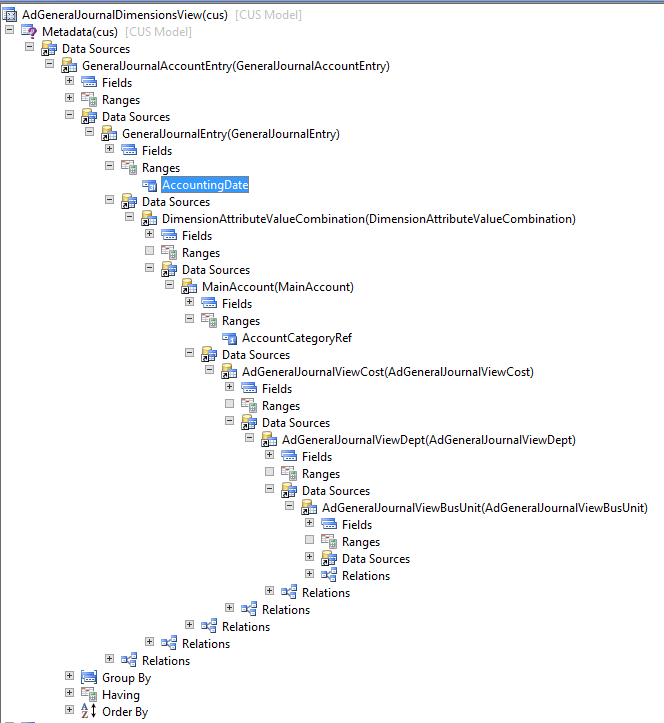
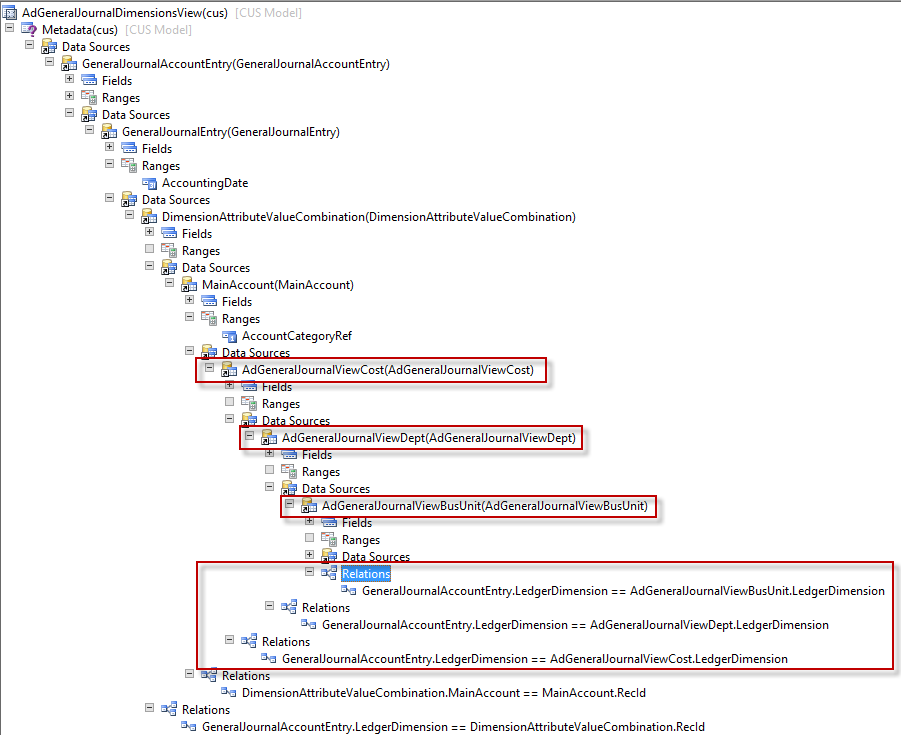
The AOT View data structure looks like this
(I have added optional ranges for AccountingDate = (YearRange(0,0)) and AccountCategoryRef = 33)
So this is the end result, closer examination shows the use of 3 further views
- AdGeneralJournalViewDept
- AdGeneralJournalViewCost
- AdGeneralJournalViewBusUnit
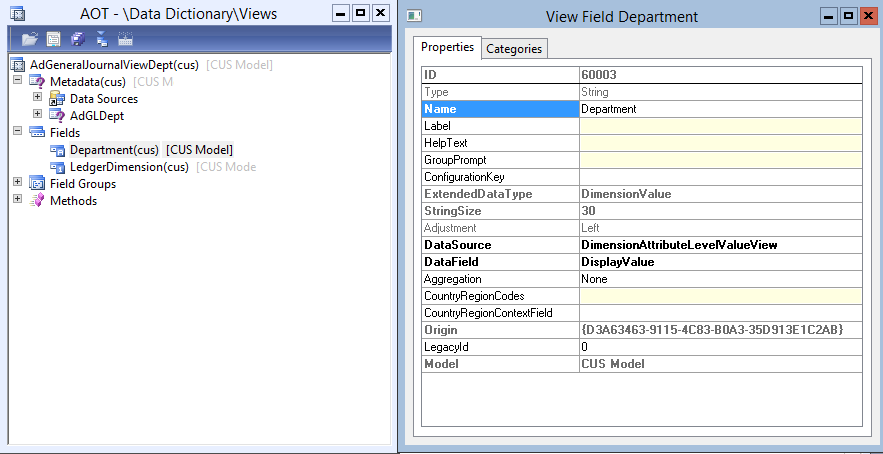
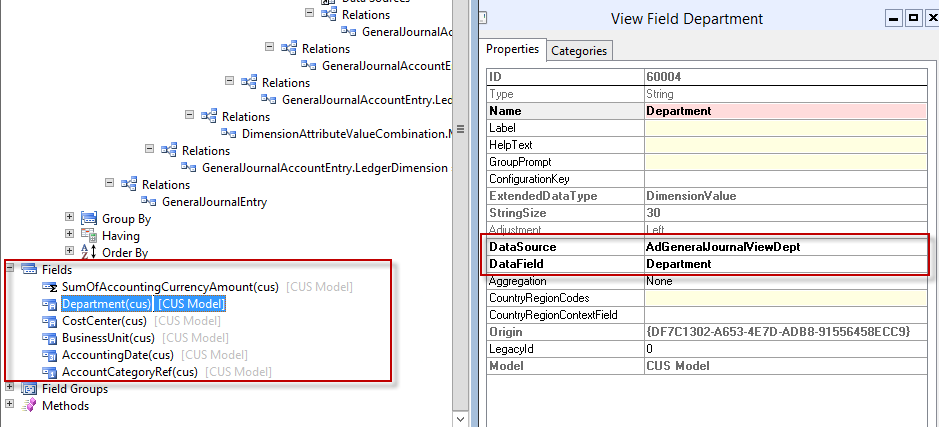
The AdGeneralJournalViewDept is an AOT View with 2 fields, Department and LedgerDimension. The other 2 Views have CostCenter and LedgerDimension and BusinessUnit and LedgerDimension.
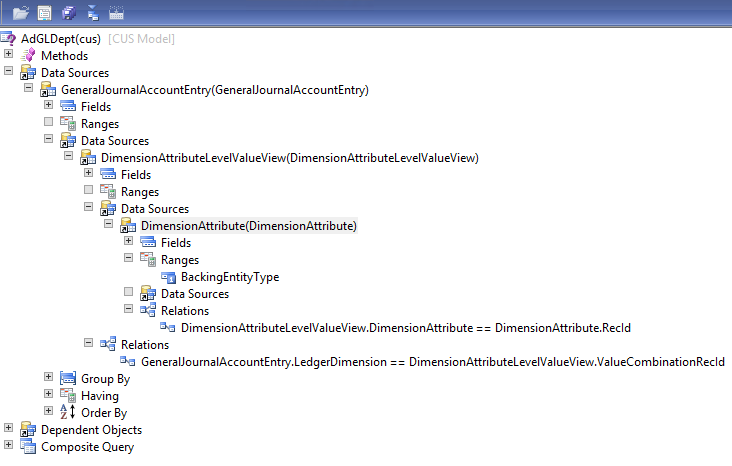
I have created 3 queries one for each View, lets look closely at the Department query.
BackingEntityType Range has a value of 11765 for the department values only.
This data structure is replicated for cost center and business unit queries. The BackingEntityType range value is the only object that changes, for Business Unit 11763 and for cost center 11764. You get these unique values from the DimensionAttribute table.
Once the 3 queries are created add them to 3 new AOT Views. We only need the DisplayValue and LedgerDimension fields from the Query. Change the View field name of the DisplayValue field in each View, ie Department, CostCenter, BusinessUnit. This is the View for the department values.
Now you are ready to build the main AOT View. Here are the relationships you need to set from your new dimension Views back to the GeneralJournalAccountEntry table. Now all joins in a View are InnerJoins only the queries can handle the outerjoins so set this type of join in the queries if needed.
Add the fields you need, add the aggregations and ranges in the View. I have aggregated the Accounting Currency Amount and added 2 ranges on Accounting Date and Main account category for added performance.
Now you have a data source that can easily be used to present and query financial dimensions in AX 2012. Welcome back LedgerTrans!
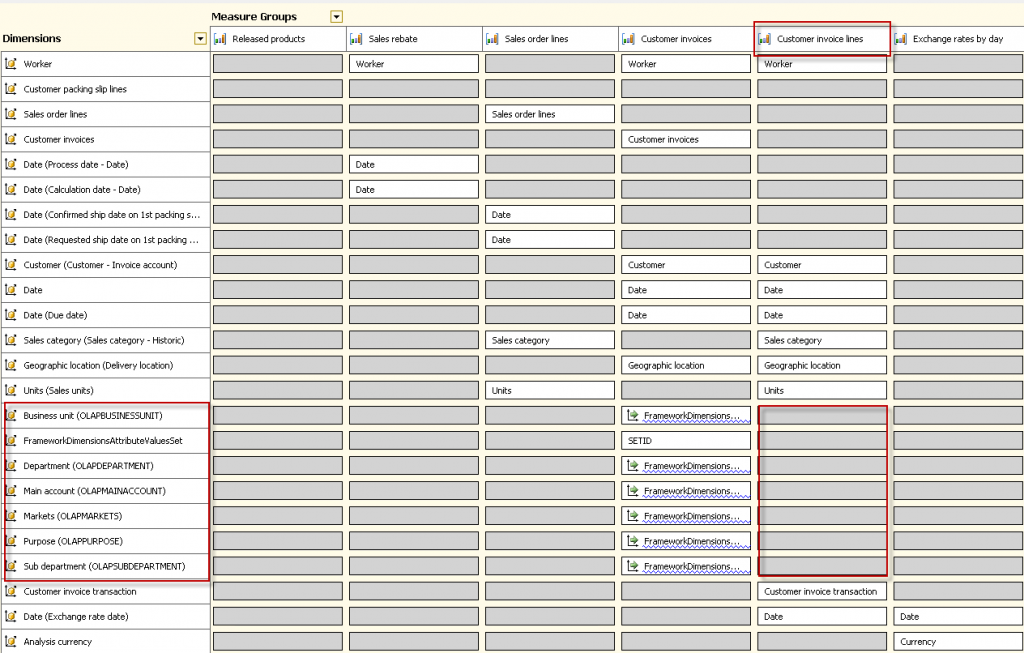
There are many reasons why you might want to do this but there are also many tools that already work well with the dimensions. After updating the standard AX Cubes you have all dimensions easily available, Management reporter handles dimensions and Atlas as well. Make sure you use the right tool.

