They are lots of really good resources dedicated to building SRS reports for AX 2012 using data providers and queries for transaction reporting. I searched and searched and was never able to find any resource that could demonstrate to me how to do the analytical reporting based on the OLAP database.
This is not for newbies even though what I’ll show you is easy, if you are new to Dynamics and reporting I would highly recommend the series of videos by Saveen Reddy – this is how I started 4 years ago.
The MDX language is an art all of its own and being able to write these queries was always a barrier to producing OLAP reports. What I didn’t know is that you do not need to know anything about MDX! But you do need to be able to work with the SQL SAS instance and Visual Studio. I will demonstrate all the steps to build your first SRS report using an MDX query.
Prerequisites
- Fully processed and updated OLAP database, steps to do this are here.
So what report shall we build? Something very simple – Customer invoice amount per year. I’ll ignore the Company Id but you will need to parameterise it later, what we want is our first MDX report.
Open Visual Studio and create a project and report framework as you have done many times before.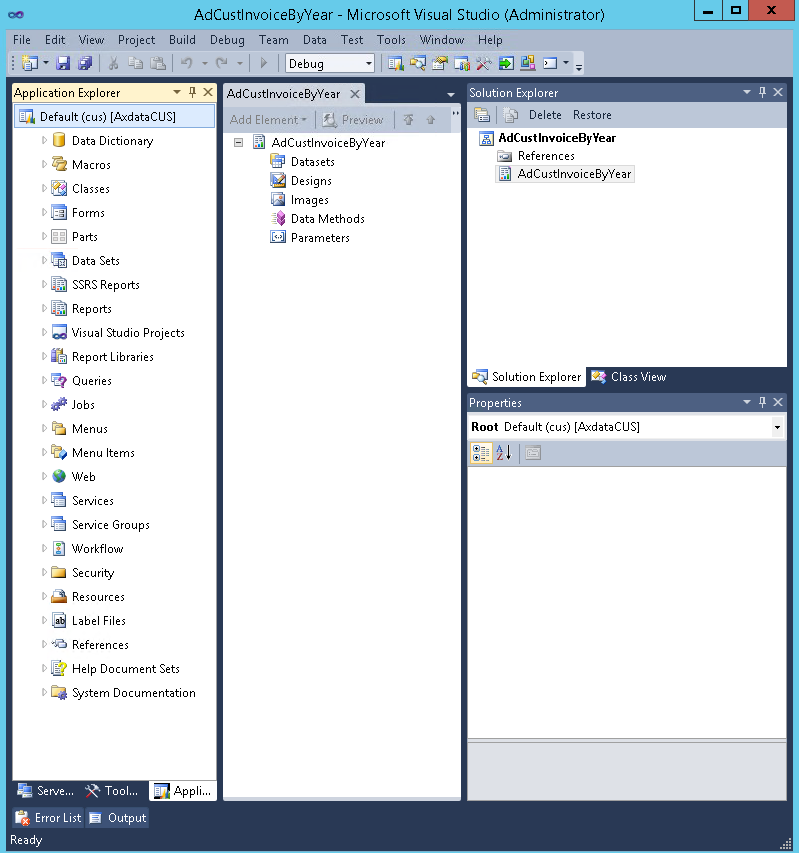
Add a dataset and give it a good name.
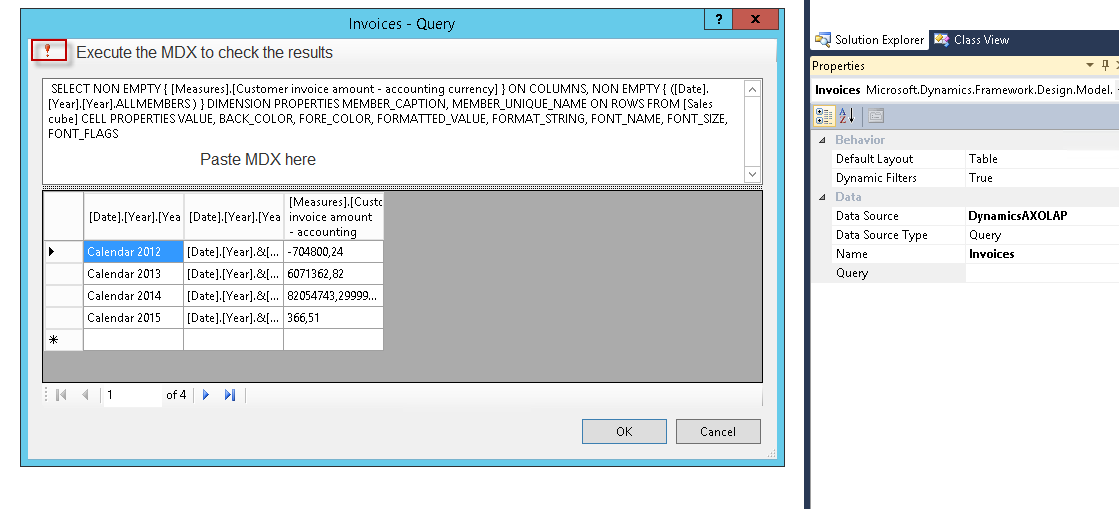
Set the Data Source property to DynamicsAXOLAP. Now we need an MDX query. I will show you how to get this in Visual Studio but you can also do it on the OLAP database as well.
Open a new instance of Visual Studio and select File > Open > Analysis Services Database…

Browse to the SAS Instance and wait for it to open. Our report will be on the Sales cube so lets open that cube. On the browser tab drag the measure and dimension you want. This is the result for me.
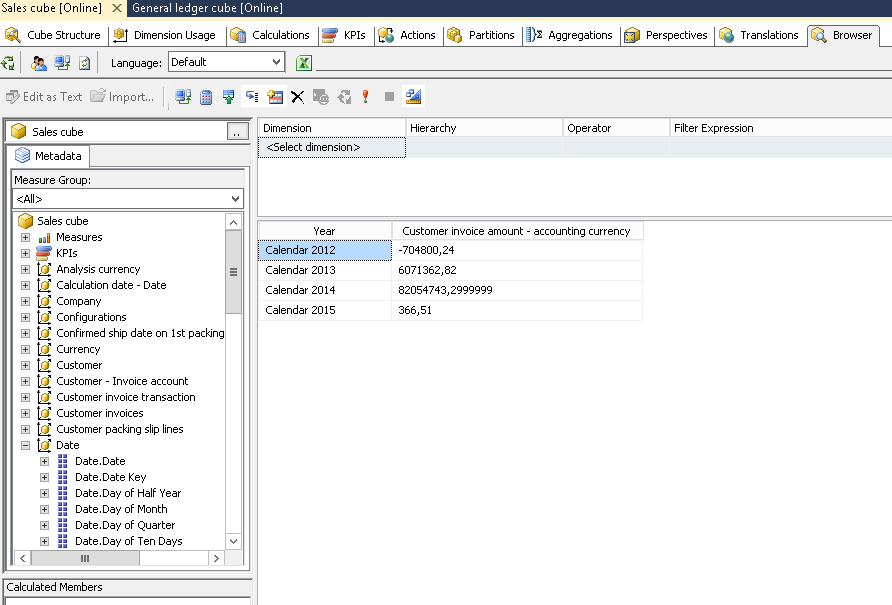
We will use the MDX statement created here and embed that into our SRS report. Switch the designer to show the MDX code and copy it.
On the dataset of the report paste the MDX
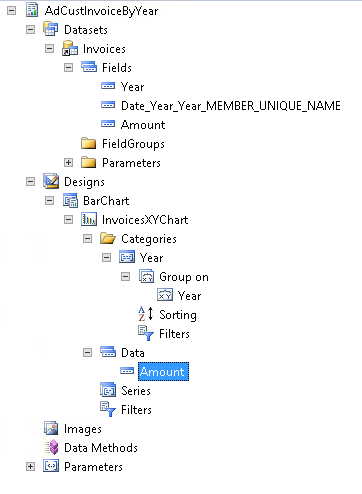
 Now we can create the report using what ever style you like. I will build a Bar Chart. Change the Default Layout on the Dataset from Table to BarChart and drag it onto the Designs node to make your AutoReport.
Set the Layout Template to “RoleCenterReportLayout” and change the AutoReport name to BarChart.
Set the Style template to BarChartStyleTemplate and change the chart sizing to suit.
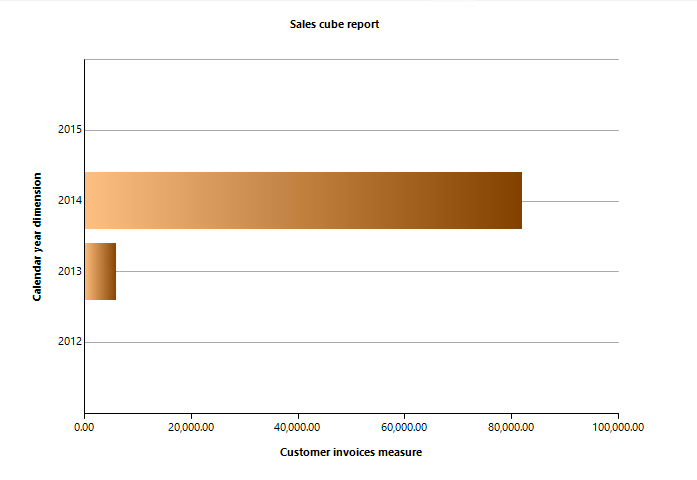
Change the display labels as the MDX default is not a good look and you should have something like this.
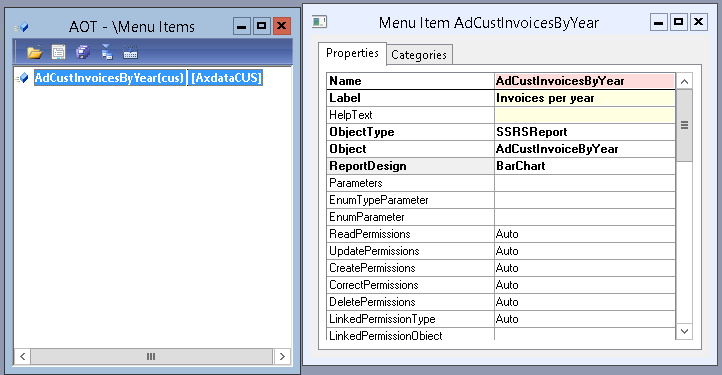
Once you are happy with the labels formatting titles etc deploy the report. Create a menu item in the AOT and open it to run the report.
Now you are ready for something a little more complicated!
